Market Volatility Explained: Why Stocks Go Up and Down
Last updated: February 2026
Your portfolio was worth $10,000 yesterday.
Today, it’s worth $9,400.
You didn’t sell anything. You didn’t make a mistake.
The market just dropped 6% overnight.
Your stomach drops. Your palms sweat. You check your phone obsessively.
“Should I sell? Am I losing money? Is this a crash?”
By tomorrow, it might bounce back to $10,200. Or it might fall further to $8,900.
You have no idea. Neither does anyone else.
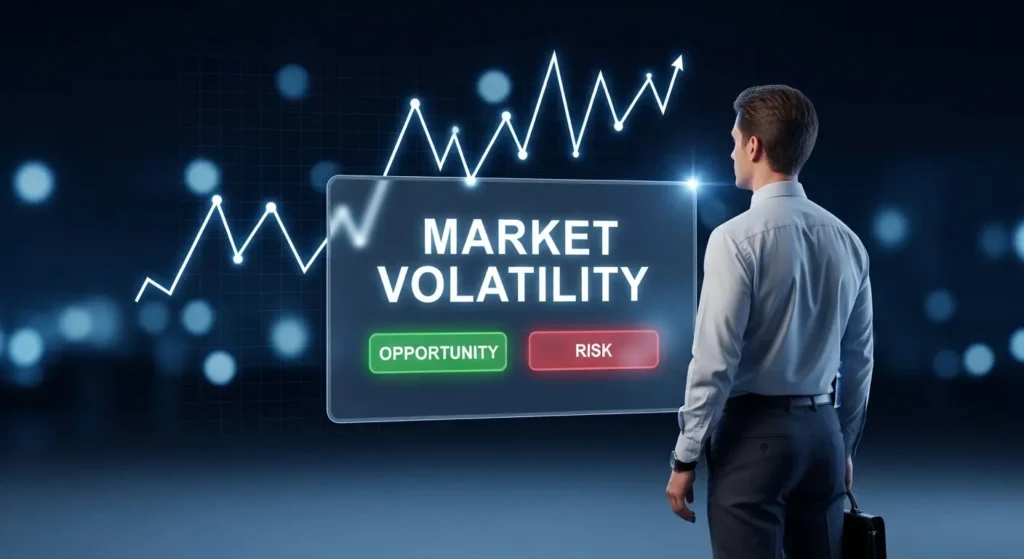
This is market volatility, and it’s the #1 reason beginners panic-sell and miss decades of wealth building.
But here’s the secret: Volatility isn’t your enemy. Understanding it is your superpower.
Most investors see volatility as chaos—unpredictable, scary, something to avoid. But experienced investors see it differently. They understand that volatility is simply the price of growth. It’s the cost of owning businesses that adapt, innovate, and compound over time.
In this guide, you’ll learn exactly what market volatility is, why it exists and what causes it, how to measure and understand it, why it’s actually healthy (not a disaster), how to emotionally handle volatility without panic-selling, the difference between volatility and actual risk, and most importantly—how to use volatility to your advantage.
By the end, you’ll stop fearing market drops and start seeing them as opportunities.
Let’s make volatility your friend.
What is Market Volatility? (Clear Definition)
Market volatility is the rapid and large price movements of stocks, bonds, or entire markets.
It’s the degree to which asset prices fluctuate up and down. High volatility means big swings.
Low volatility means steady, predictable prices.
How It Works
On a normal day:
- Stock market up 0.5% (small move, normal)
- Individual stocks up or down 1-3% (normal daily movement)
- Market is stable, predictable
On a volatile day:
- Stock market down 5-8% in a single day (big move!)
- Individual stocks up or down 10-20% (dramatic swings)
- Market is unpredictable, scary feeling
During extreme volatility:
- Stock market down 20%+ in days or weeks (crash!)
- Individual stocks down 30-50% (panic-inducing!)
- Market is chaotic, investors terrified
Real Example: 2024-2026 Market
January 2024: Market relatively calm, volatility low August 2024: One bad jobs report → Market drops 3% in one day January 2025: Fed policy changes → Market drops 5% in one week February 2026: Recovery period, volatility declining
This is normal. Volatility is constantly changing.
Key Volatility Terms
Standard Deviation: Statistical measure of price swings
- Low standard deviation: Predictable prices
- High standard deviation: Unpredictable prices
Beta: How much a stock moves relative to the market
- Beta 1.0: Moves exactly with market
- Beta 2.0: Moves twice as much as market (more volatile)
- Beta 0.5: Moves half as much as market (less volatile)
VIX (Volatility Index): “Fear index” measuring expected market volatility
- Low VIX (10-15): Market calm
- High VIX (20+): Market anxious
- Extreme VIX (40+): Market terrified
Drawdown: Peak-to-trough decline in portfolio value
- 10% drawdown: Portfolio down 10% from its peak
- 50% drawdown: Portfolio down 50% from its peak (crash)
Why Does Market Volatility Exist?
Volatility isn’t a bug in the market. It’s a feature. It exists for fundamental reasons.
Reason 1: Uncertainty About the Future
No one knows what will happen next. Economic reports might be worse than expected.
Companies might miss earnings targets. Geopolitical events might shock markets. Trade wars might start.
This uncertainty creates volatility as investors constantly adjust expectations.
Example: Fed announces interest rate decision
- Market expects 0.25% increase
- Fed announces 0.50% increase (surprise!)
- Market drops 3% immediately (reaction to uncertainty)
Reason 2: Shifting Supply and Demand
When more people want to buy stocks, prices go up (demand exceeds supply).
When more people want to sell stocks, prices go down (supply exceeds demand).
These shifts happen constantly and create price movement.
Example: Good earnings report
- Investors want to buy
- Price goes up
- Creates upward volatility
Example: Bad earnings report
- Investors want to sell
- Price goes down
- Creates downward volatility
Reason 3: Changing Interest Rates
When interest rates change, all asset values change because money becomes more or less valuable.
Example: Fed raises rates from 4% to 5%
- Bonds become more attractive (pay more)
- Stocks become less attractive (less competitive)
- Stock prices fall (volatility spike)
- Bond prices fall initially but recovers (bonds pay more)
Reason 4: Human Emotion
Fear and greed drive markets. When investors are fearful, they sell (creating downward volatility).
When investors are greedy, they buy (creating upward volatility).
This emotional volatility is temporary but real.
Example: Stock market crash
- Investors fear
- They all want to sell at once
- Massive downward volatility
- Prices overshoot actual value (too low)
- Eventually fear subsides
- Investors buy back in
- Prices recover
Reason 5: Black Swan Events
Unexpected, rare events shock markets and create extreme volatility.
Historical Examples:
- 2008: Financial crisis (extreme volatility)
- 2020: COVID pandemic (extreme volatility)
- 2022: Russia-Ukraine war (increased volatility)
- 2024-2026: Various geopolitical events (periods of volatility)
These are unpredictable but happen periodically.
What Causes Market Volatility?
Understanding specific causes helps you stay calm during volatility.
Economic Causes
GDP Growth Changes
- Faster growth expected → Stock prices up
- Slower growth expected → Stock prices down
Inflation Changes
- Inflation rising → Central banks raise rates → Stocks fall
- Inflation falling → Central banks cut rates → Stocks rise
Employment Reports
- Job creation strong → Market up
- Job creation weak → Market down
Corporate Earnings
- Companies beat earnings → Stock prices up
- Companies miss earnings → Stock prices down
Policy Causes
Interest Rate Changes
- Rate increase → Stock market down (bonds more attractive)
- Rate decrease → Stock market up (stocks more attractive)
Tax Policy Changes
- Higher taxes expected → Market down
- Lower taxes expected → Market up
Trade Policy Changes
- Trade war fears → Market down
- Trade deal announcement → Market up
Geopolitical Causes
War or Conflict
- Military conflict → Market drops (uncertainty)
- Conflict resolution → Market recovers
Political Elections
- Election uncertainty → Volatility high
- Election results clear → Volatility often decreases
International Crises
- Pandemic → Extreme volatility
- Banking crisis → Extreme volatility
- Natural disaster → Temporary volatility
Psychological Causes
Fear and Panic Selling
- One big drop triggers panic
- Panic causes more selling
- Creates downward spiral (temporary)
Greed and Euphoria
- Big gains trigger FOMO (fear of missing out)
- Everyone wants to buy
- Creates upward spiral (temporary)
Regime Changes
- Market switches from growth to value (or vice versa)
- Different stocks lead market
- Creates volatility as leadership shifts
Measuring Volatility: The VIX and Standard Deviation

VIX (Volatility Index)
The VIX is the “fear gauge” of the market. It measures expected volatility over the next 30 days.
How it works:
- VIX calculated from S&P 500 options prices
- Higher option prices = market expects more volatility = higher VIX
- Lower option prices = market expects less volatility = lower VIX
For real-time VIX data and detailed volatility analysis, the official Chicago Board Options Exchange (CBOE) provides historical volatility information.
VIX Levels and What They Mean:
10-15 (Low Volatility)
- Market calm and stable
- Investors confident
- Good environment for steady investing
- “Normal times”
15-20 (Moderate Volatility)
- Market showing some swings
- Some investor concern
- Still healthy market environment
- “Typical volatility”
20-30 (High Volatility)
- Market significantly uncertain
- Investors anxious
- Market drops 5-10% common
- “Elevated anxiety”
30-50 (Extreme Volatility)
- Market in crisis mode
- Investors panicked
- Market crashes 15%+ possible
- “Fear mode”
50+ (Extreme Panic)
- Market in full panic
- Crashes 20%+ happening
- Rare historical events (2008, 2020)
- “Panic mode”
Standard Deviation (Statistical Volatility)
Measures how much returns swing around the average.
Example: Stock Returns
Stock A: Returns 8%, 10%, 9%, 9%, 9% (consistent, low volatility)
- Average return: 9%
- Deviation from average: Very small
- Standard deviation: Low (~1%)
- Verdict: Stable
Stock B: Returns 15%, 5%, 20%, -5%, 15% (swinging widely, high volatility)
- Average return: 10% (about same)
- Deviation from average: Very large
- Standard deviation: High (~10%)
- Verdict: Volatile
Key insight: Two stocks can have similar average returns but very different volatility.
Stock A is more predictable. Stock B is wilder.
Beta (Relative Volatility)
Measures how much a stock swings relative to the overall market.
Beta 1.0: Stock moves exactly with market
- Market up 10% → Stock up 10%
- Market down 10% → Stock down 10%
- Average volatility
Beta 2.0: Stock moves twice as much as market
- Market up 10% → Stock up 20%
- Market down 10% → Stock down 20%
- High volatility, high risk, high reward
Beta 0.5: Stock moves half as much as market
- Market up 10% → Stock up 5%
- Market down 10% → Stock down 5%
- Low volatility, lower risk, lower returns
Why it matters: Higher beta stocks are riskier but potentially more rewarding.
Lower beta stocks are safer but less exciting.
Historical Volatility Examples
2008 Financial Crisis (Extreme Volatility)
What happened:
- Housing market collapsed
- Banks failed
- Credit markets froze
- Stock market crashed 57%
The SEC provides detailed historical information about major market events and volatility periods for investor education.
Volatility:
- VIX hit 80 (extreme panic)
- Daily swings 5-10% common
- Month drops 15-20% happened
- Recovery took 4+ years
Lesson: Crashes happen. But they recover. Investors who stayed invested recovered fully and made gains.
Investors who panic-sold locked in losses.
2020 COVID Pandemic (Extreme but Brief Volatility)
What happened:
- Pandemic shock
- Lockdowns announced
- Unemployment spiked
- Stock market dropped 34% in 23 days
Volatility:
- VIX hit 82 (extreme panic)
- Daily swings 5-8% common
- Massive uncertainty everywhere
What happened next:
- Recovery happened FAST
- Market hit new highs within 6 months
- Those who panicked-sold missed the recovery
- Those who bought the dip got huge gains
Lesson: Volatility extremes create opportunities. Scary moments are often best buying moments.
2022 Inflation & Rising Rates (Moderate Volatility)
What happened:
- Inflation hit 40-year highs
- Fed raised rates aggressively
- Growth stocks fell 30-40%
- Bonds fell 10-15%
Volatility:
- VIX stayed elevated (25-35) for months
- Daily swings 2-3% common
- Monthly swings 5-10% happened
- High stress for investors
Lesson: Extended volatility is tougher than crash-and-recovery. But still temporary.
2024-2026 (Normal Volatility with Spikes)
What happened:
- Normal market fluctuations
- Occasional geopolitical shocks
- Fed policy adjustments
- Corporate earnings ups and downs
Volatility:
- VIX mostly 12-25 range
- Normal 1-2% daily swings
- Occasional 3-5% swings
- “Normal volatility environment”
Lesson: This is what normal looks like. Not exciting, but how markets work.
Volatility vs Risk: They’re Not the Same Thing
This is crucial to understand.
Volatility = Price movement (short-term) Risk = Permanent loss of capital (long-term)
Example: Stock A vs Stock B
Stock A (Volatile but Safe):
- Swings 20% regularly (high volatility)
- Strong company, growing earnings
- Unlikely to go bankrupt
- Low permanent risk
Stock B (Stable but Risky):
- Swings only 5% regularly (low volatility)
- Weak company, declining earnings
- Might go bankrupt
- High permanent risk
Which is riskier?
Stock B! Despite lower volatility, it has higher risk because it might actually lose all your money.
Stock A is volatile but ultimately safe because the company is strong.
Real Example: Amazon Stock
Early Amazon (1997-2005):
- Highly volatile (swings 30-50% yearly)
- Very scary to investors
- But low permanent risk (great company)
- Those who stayed invested: Made 100%+ returns
Outcome: High volatility, low actual risk. Volatility was an opportunity, not a danger.
The Key Insight
For long-term investors:
- Volatility is opportunity (buy low during drops)
- Risk is permanent loss (company goes bankrupt)
For short-term traders:
- Volatility is danger (your timeline is too short to recover)
- Risk is also danger (both matter)
This is why timeline matters. A 30-year-old with 35 years until retirement?
Volatility is his friend (buys more shares cheap). A 65-year-old needing money this year?
Volatility is his enemy (can’t wait for recovery).
The Psychology of Volatility: Why You Panic-Sell
Understanding the psychology helps you avoid the biggest mistake.
The Fear Response
What happens during market crash:
Day 1: Market down 5%
- You notice portfolio dropped $500
- You feel mild concern
- “Is this a crash?”
Day 3: Market down 10%
- You notice portfolio dropped $1,000
- You feel real fear
- “When should I sell?”
Day 7: Market down 15%
- You notice portfolio dropped $1,500
- You feel panic
- “I need to protect myself!”
Day 10: Market down 20%
- You notice portfolio dropped $2,000
- You feel terror
- “I’m selling NOW before it gets worse!”
The tragedy: You sell at the worst possible time (the bottom)
Then what happens:
Day 15: Market bounces up 5%
- You sold at -20%, missed the recovery
- You realize mistake
- “I locked in losses!”
Day 30: Market back to even
- Everyone who stayed invested: Breakeven
- You who panic-sold: Down 20%
- Regret is intense
Why This Happens (Evolution)
Your brain is designed for survival, not investing. During crisis, evolution kicks in:
Fight, Flight, or Freeze Response:
- Fight: “I’ll trade frantically to fix this!” (usually loses money)
- Flight: “I’m selling everything and hiding!” (locks in losses)
- Freeze: “I can’t look at my portfolio!” (at least you don’t sell)
This response was helpful 10,000 years ago when danger was real. Today it’s destructive to wealth building.
The Panic Selling Cycle
- Market drops → Fear activates
- Fear grows → Urgency increases
- Urgency peaks → You must act NOW
- You sell → Panic subsides temporarily
- Market recovers → You regret decision
- Market new highs → Deep regret
This cycle repeats every few years. Most investors experience it multiple times.
Volatility Across Different Asset Types
Not all investments are equally volatile.
Volatility Ranking (High to Low)
Individual Growth Stocks: Highest Volatility
- Swings 20-50% yearly
- Daily moves 2-5% common
- Exciting but stressful
- Requires strong stomach
Stock Index Funds: High Volatility
- Swings 15-25% yearly
- Daily moves 1-2% common
- More stable than individual stocks
- Diversification helps
Dividend Stocks: Moderate Volatility
- Swings 10-15% yearly
- Daily moves 0.5-1.5% common
- Income provides cushion
- Less stressful
Bonds: Low Volatility
- Swings 3-8% yearly
- Daily moves 0.1-0.5% common
- Predictable income
- Boring but stable
Balanced Portfolio (60/40): Low-Moderate Volatility
- Swings 8-12% yearly
- Daily moves 0.5-1% common
- Stocks and bonds offset each other
- Best of both worlds
Cash/Money Market: Nearly Zero Volatility
- Swings <1% yearly
- Daily moves almost zero
- Ultra-safe
- Losing to inflation over time
The Volatility-Return Trade-off
Higher volatility investments = Higher expected returns Lower volatility investments = Lower expected returns
You can’t have both (high returns with zero volatility). That’s the fundamental trade-off.
This is why asset allocation matters. You can’t avoid volatility entirely, but you can match it to your timeline and psychology.
How to Handle Volatility Without Panic-Selling

This is the most important section.
Here’s how to stay sane during market drops.
Strategy 1: Understand Your Timeline
If you have 10+ years:
- Market drops don’t matter
- You’re guaranteed to recover
- Market crashes are buying opportunities
- Action: Increase investing during crashes
If you have 5-10 years:
- Market drops matter somewhat
- You’ll likely recover but not guaranteed
- Reduce volatility with bonds
- Action: Stay the course
If you have 2-5 years:
- Market drops matter significantly
- You need lower volatility
- Reduce stock allocation
- Action: Already have appropriate allocation
If you have under 2 years:
- Market drops are unacceptable
- You need nearly zero volatility
- Use bonds and cash
- Action: Don’t own stocks
Strategy 2: Dollar-Cost Averaging
Invest the same amount every month, regardless of market conditions.
How it works:
Month 1: Market normal, price $100/share
- Invest $1,000
- Buy 10 shares
- Cost: $100/share
Month 2: Market crashes, price $80/share
- Invest $1,000
- Buy 12.5 shares (cheaper!)
- Cost: $80/share
- Now you own more shares
Month 3: Market recovers, price $110/share
- Invest $1,000
- Buy 9.1 shares (more expensive)
- Cost: $110/share
Result: You bought more shares when market was cheap. Your average cost is $96.30.
When market recovers to $120, you make money.
The magic: Volatility becomes your advantage, not your enemy.
Strategy 3: Stop Checking Your Portfolio
Don’t:
- Check daily (causes panic)
- Check during market crashes (causes emotional decisions)
- Compare to friends’ portfolios (causes comparison anxiety)
Do:
- Check quarterly (enough to stay informed)
- Check only after markets close (avoid hourly drama)
- Focus on long-term trends, not daily swings
The truth: Your portfolio probably looks the same or better.
Checking more frequently doesn’t improve outcomes, just increases stress.
Strategy 4: Reframe Volatility as Opportunity
Old thinking: “Market crashed! I’m losing money! Sell!”
New thinking: “Market crashed! Stock prices are on sale! Buy more at discount prices!”
This mental reframe is powerful. When you view crashes as opportunities instead of disasters, you actually invest more during them (dollar-cost averaging works better).
Strategy 5: Have Cash Ready
Keep some money aside (not invested) so during extreme market drops, you can buy without selling.
Example:
- Portfolio: $100,000 (invested)
- Cash reserve: $10,000 (uninvested, waiting)
- Market crashes 30%
- You invest cash at bottom
- Market recovers
- You just made 30% on $10,000 = $3,000 gain
This turns crashes into profit opportunities.
Strategy 6: Remember History
Every market crash in history has recovered. Every single one.
- 2008 crash: Recovered in 4 years
- 2020 crash: Recovered in 4 months
- 2022 decline: Recovered in 1 year
- Historical average: Recovers in 2-3 years
Perspective: If you can wait 3-5 years, crashes don’t matter. And if you’re investing for retirement, you have plenty of time.
Using Volatility to Your Advantage
Smart investors don’t fear volatility
They use it.
The Buy-Low Strategy
Normal times:
- Market steady
- Prices fair value
- Boring
Volatile times (crashes):
- Market down 20%
- Prices discounted
- Opportunity!
Smart investors:
- Have extra cash during normal times
- Wait patiently for crashes
- Buy aggressively when prices are cheap
- Watch them rebound to profit
Rebalancing Strategy
Using volatility to rebalance:
Normal times: Portfolio 60% stocks / 40% bonds
Market crashes:
- Stocks down 30%
- Portfolio becomes 45% stocks / 55% bonds
- Out of balance!
Smart move:
- Sell some bonds (up in value)
- Buy stocks (down in value)
- Rebalance back to 60/40
- You bought low and sold high automatically!
Dividend investing During Volatility
During market crashes:
- Stock prices fall
- Dividend yields rise
- $100 stock paying $3 dividend = 3% yield (normal)
- Drops to $70 stock paying $3 dividend = 4.3% yield (attractive!)
- Income investors buy
- Stock eventually recovers
- Plus they’ve collected extra dividends
Volatility creates income opportunities for dividend investors.
Frequently Asked Questions — FAQ 👈
Q: Is there a “good” level of volatility?
A: For long-term investors, moderate volatility (15-20% annual swings) is ideal.
High enough to create buying opportunities, low enough to not cause panic-selling.
Q: Can I predict when volatility will spike?
A: No. If you could, you’d be a billionaire. Volatility spikes are surprises.
This is why you need a plan to handle them calmly.
Q: Should I buy when VIX is high?
A: Not automatically. High VIX means fear, which means prices are depressed, which means opportunity.
But VIX can stay high for weeks. Dollar-cost averaging (regular investing) is better than trying to time it.
Q: Is volatility the same as risk?
A: No. Volatility is price swings (temporary). Risk is permanent loss (bankruptcy). For long-term investors, volatility doesn’t equal risk.
Q: How much volatility is “too much”?
A: That’s personal. If you panic-sell at 30% drops, you need less volatility (more bonds).
If you stay calm and buy during 50% crashes, you can handle more volatility (more stocks).
Q: Should I reduce stock allocation to avoid volatility?
A: Only if you can’t psychologically handle it. If you can wait years for recovery, volatility doesn’t matter.
But if you’ll panic-sell, reducing volatility is better than staying invested while panicking.
Q: What if volatility crashes my portfolio right before retirement?
A: This is called sequence of returns risk. Solution: Reduce stock allocation 5-10 years before retirement.
By retirement, you’re mostly in bonds (stable). No more crash risk.
🎥 BONUS
Want to see real examples of how market volatility works throughout different time periods?
This video shows historical volatility patterns and how investors successfully navigated them:
FINAL THOUGHTS: Volatility is Not Your Enemy
Here’s what separates millionaires from broke people: Their relationship with volatility.
Broke people fear volatility. They see drops as disasters.
When market crashes, they panic and sell at the worst time. They miss recoveries. They never build wealth.
Millionaires understand volatility. They see drops as discounts. When market crashes, they stay calm and buy.
They capture recoveries. They build wealth.
The difference isn’t intelligence. It’s psychology.
You now know the truth about volatility.
It’s temporary. It’s predictable (on average).
It’s happened hundreds of times historically and the market has always recovered.
It’s not a sign to sell; it’s a sign to stay the course or even buy more.
Your first market crash will be scary. You’ll want to panic-sell. Your instincts will scream “Get out!”
Don’t listen to those instincts.
Instead, remember:
- Your timeline is long (if you’re a real long-term investor)
- Market always recovers
- Crashes are opportunities
- Staying invested through crashes makes you rich
- Panic-selling through crashes makes you broke
The market will crash again. Maybe next month, maybe next year, maybe in three years. You don’t know when. But it WILL happen.
When it does, you’ll know what to do: Nothing. Stay invested. Maybe even buy more.
That’s the mindset that builds lasting wealth.
INTERESTING TOPICS
Ready to understand how to diversify your portfolio across multiple assets and sectors?
Want to discover how dollar-cost averaging removes emotion from investing decisions?
Need to learn how stocks and bonds work together to reduce volatility?
Want more financial insights delivered to you? Subscribe to our newsletter
and get weekly articles with practical strategies to grow your wealth sent straight to your inbox.
Obs: Sign up for our newsletter and receive a free Finance For Beginner eBook.
Disclaimer: This article is for educational purposes only. Diversification does not guarantee profits or protect against all losses. Consider your financial situation, risk tolerance, and investment timeline before making investment decisions.
—— End of Article ——