Understanding Market Crashes: Why They Happen and How to Survive Them
Last updated: February 2026
It’s 3 AM and you can’t sleep.
Your portfolio was worth $50,000 yesterday. Today it’s worth $35,000. The stock market crashed 30% in three weeks. News headlines are screaming “MARKET COLLAPSE” and “INVESTORS PANIC.”
Your hands are shaking. Your stomach is in knots. You’re thinking: “Should I sell everything and run?”
Every instinct is telling you to get out. To protect yourself. To do SOMETHING.
This is the moment that defines whether you become wealthy or broke.
Most people panic-sell here. They lock in massive losses. They miss the recovery that always follows. They never build real wealth.
This article was prepared especially for Finance For Beginner subscribers who requested this type of content due to the challenges they face in their personal and professional finances, for a better understanding.
But you don’t have to be most people.
Understanding market crashes isn’t about predicting them. It’s about understanding that they’re temporary, normal, and historically always followed by recovery. It’s about having a plan so when fear hits, you already know what to do.
In this guide, you’ll learn what causes market crashes, why they happen regularly, historical examples and recovery times, the psychology of why people panic-sell, why crashing is actually healthy for markets, how long crashes typically last, what to do (and NOT do) during a crash, and most importantly—how to use crashes to become wealthier.
By the end, you’ll see market crashes not as disasters, but as opportunities.
Let’s demystify the crash.
What is a Market Crash? (Clear Definition)
A market crash is a rapid and significant decline in stock market prices, typically 20% or more from recent highs, in a short period of time.
In simpler terms: Prices drop fast and hard.
How It’s Defined
Correction: 10-20% decline (scary but happens regularly) Bear Market: 20%+ decline lasting months or years (serious) Crash: 20%+ decline in days or weeks (sudden and severe) Panic: 30%+ decline with extreme selling (extreme fear)
Real Examples
2008 Financial Crisis:
- Decline: 57%
- Duration: October 2007 – March 2009
- Severity: Extreme panic
- Recovery: 4+ years
2020 COVID Crash:
- Decline: 34%
- Duration: February – March 2020
- Severity: Extreme panic (but brief)
- Recovery: 4 months
2022 Tech Selloff:
- Decline: 20-30% (depending on sector)
- Duration: January – September 2022
- Severity: Moderate panic
- Recovery: 1 year
2024-2026 Various Events:
- Multiple smaller crashes (10-15%)
- Durations: Days to weeks
- Severity: Moderate concern
- Recovery: Weeks to months
What Causes Market Crashes?
Crashes don’t happen randomly. They have triggers.
Trigger 1: Economic Shock
What it is: Unexpected bad economic news
Examples:
- Recession announced
- Unemployment spikes suddenly
- GDP growth turns negative
- Interest rates spike dramatically
Why it crashes:
- Investors assume corporate profits will fall
- If profits fall, stock values fall
- Everyone wants to sell at once
- Prices drop fast
2008 example: Banks failed → Credit froze → Companies couldn’t operate → Stock market crashed
Trigger 2: Geopolitical Crisis
What it is: War, terrorism, political instability
Examples:
- War breaks out
- Terrorist attack
- Political coup
- International conflict
Why it crashes:
- Uncertainty everywhere
- Investment money flees to safety
- Risk assets (stocks) sold
- Flight to safety (bonds, cash)
Ukraine 2022 example: War started → Energy prices spiked → Investors panicked → Markets down
Trigger 3: Financial Crisis
What it is: Banks, institutions, or major companies fail
Examples:
- Bank collapse
- Real estate crash
- Corporate bankruptcy
- Credit markets seize up
Why it crashes:
- Loss of confidence in system
- “If that company failed, what else will fail?”
- Contagion fears
- Sell-first mentality
2008 example: Lehman Brothers collapsed → Confidence shattered → Everything sold → Crash
Trigger 4: Valuation Bubble Burst
What it is: Prices got irrationally high and finally correct
Examples:
- Tech bubble (2000)
- Real estate bubble (2008)
- Growth stock bubble (2022)
- Crypto bubble (2017, 2022)
Why it crashes:
- Prices unsustainable
- Fundamentals don’t support valuations
- Reality hits
- Correction happens fast
2022 example: Growth stocks were 80% overvalued → Reality hit → 30-40% correction
Trigger 5: Policy Shock
What it is: Government makes unexpected policy change
Examples:
- Fed raises rates suddenly
- Tax policy changes dramatically
- Trade war starts
- Regulations change
Why it crashes:
- Changes investment calculations
- What was profitable becomes unprofitable
- Uncertainty about future
- Immediate selling
Historical Market Crashes and Recovery Times
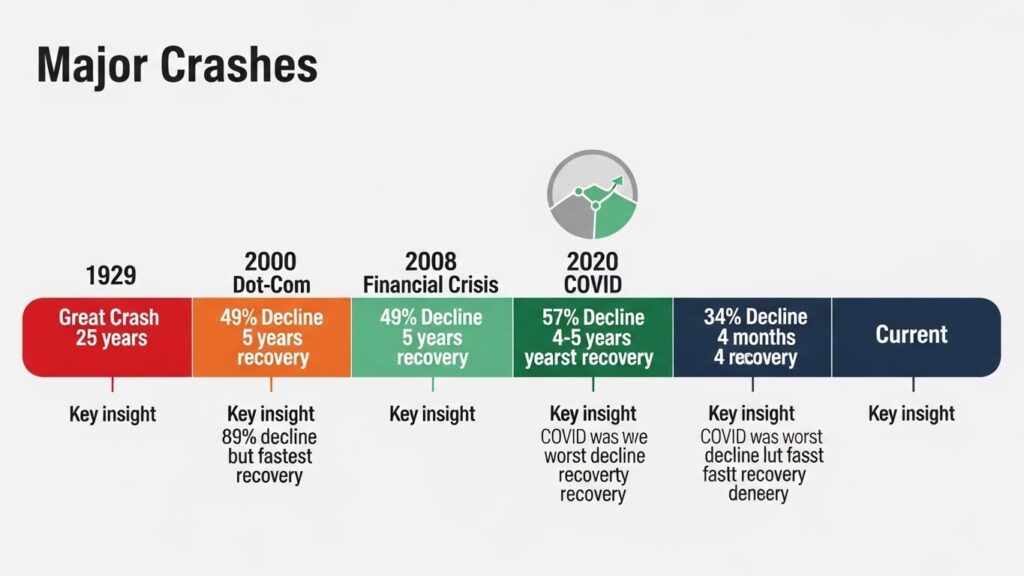
The most important data for your psychology:
1929 Great Crash
Decline: 89% Recovery time: 25 years (!) But: Market went to new highs after Key insight: Even worst crash in history recovered
For detailed historical data on past market crashes, recovery times, and investor performance during downturns, the Federal Reserve Economic Data provides comprehensive financial history.
1987 Black Monday
Decline: 22% in ONE day Recovery time: 2 years Interesting: No economic reason, just panic Key insight: Single worst day recovered quickly
2000 Dot-Com Bubble
Decline: 49% Duration: 2000-2002 Recovery time: 5 years Key insight: Tech bubble worse than financial crisis in some ways
2008 Financial Crisis
Decline: 57% Duration: October 2007 – March 2009 Recovery time: 4-5 years Important: Not back to peak until 2013 Key insight: Longest modern recovery time
2011 European Crisis
Decline: 19% Duration: 2 months Recovery time: 3-4 months Key insight: Quick recovery when panic subsides
2020 COVID Crash
Decline: 34% Duration: 23 days (fastest crash ever) Recovery time: 4 months Remarkable: New highs within 6 months Key insight: Fastest crash and fastest recovery
2022 Tech Selloff
Decline: 20-30% (tech heavier) Duration: Full year Recovery time: 1 year (fully recovered by end 2023) Key insight: Extended decline but steady recovery
Pattern Across All Crashes
✅ All recovered
✅ All reached new highs eventually
✅ Recovery times ranged 2 months to 5 years
✅ Staying invested through crash = profitability
✅ Panic-selling during crash = permanent loss
Why Crashes Are Normal and Healthy
This sounds crazy, but crashes are GOOD for markets.
Reason 1: They Reset Valuations
Without crashes:
- Stocks get irrationally expensive
- Disconnect between price and reality grows
- Eventually explodes (worse)
With crashes:
- Overpriced stocks get reset
- Valuations return to reality
- Foundation for next bull market
Benefit: Crashes clean out the excess and allow healthy growth to continue.
Reason 2: They Separate Serious from Casual Investors
During crashes:
- Casual investors panic-sell (exit market)
- Serious investors buy (enter market)
- Money transfers from weak hands to strong hands
Result: Smart money accumulates, weak money exits. This creates next bull market.
Reason 3: They Create Opportunities
Before crash: Everything expensive (hard to find deals) During crash: Everything on sale (easy to find deals) After crash: Recovery creates massive gains
Benefit: Crashes create the best buying opportunities. Without crashes, you never get these chances.
Reason 4: They Test System Resilience
Without crashes:
- System never tested
- Hidden weaknesses never exposed
- Eventually catastrophic failure
With crashes:
- System stress-tested
- Weaknesses exposed and fixed
- System gets stronger
Benefit: Regular small crashes prevent catastrophic big crashes.
The Psychology of Panic: Why You Want to Sell
Understanding WHY you panic helps you prevent it.
The Fear Response
Your brain is hardwired for survival. During crashes, evolution kicks in:
Fight response: “I’ll trade frantically to fix this!” Flight response: “I’m selling everything and getting out!” Freeze response: “I can’t look at portfolio”
These responses were useful 10,000 years ago. Today they destroy wealth.
The Pain of Loss
Psychological research shows: Loss hurts 2x more than equivalent gain feels good.
Example:
- Gaining $10,000: Feels good (+100 happiness)
- Losing $10,000: Feels terrible (-200 happiness)
During crash:
- Portfolio down $15,000
- Pain is INTENSE
- Brain screams “GET OUT NOW!”
- You want to sell to make pain stop
The Regret Fear
“What if it goes down more?”
During crashes, this fear is overwhelming:
- “If I sell now, I’ll preserve $35,000”
- “If I wait and it drops to $20,000, I’ll lose more”
- “I MUST sell NOW before it gets worse!”
Problem: You’re making decision based on fear, not reason.
The Social Pressure
Everyone is panicking:
- News headlines screaming doom
- Friends selling their portfolios
- Social media full of fear
- “Smart money” saying to wait it out
- Pressure to do SOMETHING
You feel:
- Alone if you stay invested
- Part of group if you sell
- Social pressure to panic-sell
The Damage of Panic-Selling
Let’s show what actually happens.
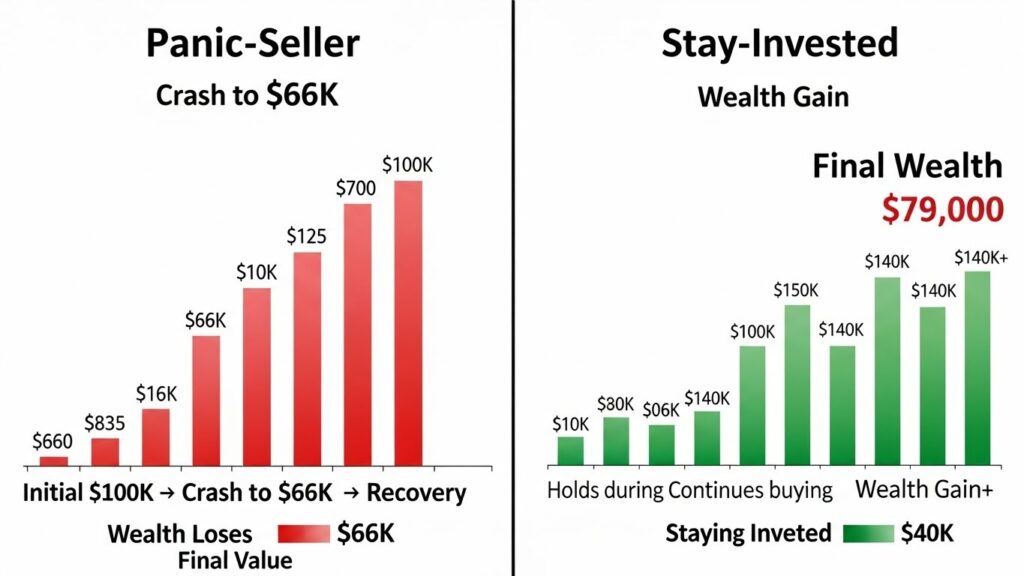
Scenario: 2020 COVID Crash
Your situation:
- Portfolio: $100,000 (invested in index fund)
- You’re invested for retirement (30 years away)
- Market crashes 34%
Path 1: You Panic-Sell (WRONG)
March 15, 2020: Market drops 34%
- Portfolio: $66,000
- Pain: Intense
- You panic-sell (lock in loss)
- Cash: $66,000
April 2020: Market starts recovering
- Market up 10% from bottom
- But you’re sitting in cash
- Your $66,000 is still $66,000
- You missed recovery
June 2020: Market back to breakeven
- People who held: Break even ($100,000)
- You who sold: $66,000 still (locked in loss)
- Your loss: $34,000 permanent
Why you don’t buy back:
- “What if it crashes again?”
- You’re scared
- You stay in cash
- You miss bull market
Result 1 year later (2021):
- Market at all-time highs (+40% from previous peak)
- People who held: $140,000
- You who panicked: Still $66,000
- Your opportunity cost: $74,000!
Path 2: You Stay Invested (RIGHT)
March 15, 2020: Market drops 34%
- Portfolio: $66,000
- Pain: Intense
- But you remember: “I’m investing for 30 years”
- You stay invested
April 2020: Market starts recovering
- Market up 10%
- Your portfolio: $72,600
- You’re buying the recovery
June 2020: Market back to breakeven
- Your portfolio: $100,000
- You’ve recovered completely
- You didn’t lock in losses
December 2020: Bull market in full swing
- Your portfolio: $115,000
- You’re making money
- You’re glad you stayed
Result 1 year later (2021):
- Your portfolio: $140,000
- You made $40,000 gain
- Plus you bought MORE during crash
- Your portfolio: $145,000+
Difference: Staying invested vs panic-selling = $79,000 advantage!
How Long Do Crashes Last?
This is crucial for your mindset.
Duration Data
Average crash duration: 4-6 months Average recovery time: 1-3 years Worst case (2008): 4-5 years Best case (2020): 4 months
Timeline Psychology
Week 1 of crash:
- Panic high
- Fear at maximum
- “Buy the dip” sentiment
- Actually good buying opportunity
Week 2-3:
- Fear extending
- More selling
- Capitulation phase
- Often near bottom
Month 1-2:
- News is worst
- Pessimism everywhere
- Actually best time to buy
- But feels most scary
Month 2-3:
- Stabilization begins
- Selling pressure eases
- Recovery starts quietly
- Most miss beginning of recovery
Month 3-6:
- Obvious recovery
- Everyone wants back in
- Rally happening
- Miss opportunity if you sold
Month 6-12:
- New highs established
- Bull market obvious
- Too late to buy
Key Insight
By the time you FEEL confident enough to buy back, the recovery is already 70% done.
This is why timing the market is impossible.
What NOT to Do During a Crash
Clear rules to prevent damage.
❌ DON’T: Panic-Sell
Don’t sell just because price dropped.
- You locked in losses
- You’ll regret it
- The only reason to sell: You need the money for an emergency
❌ DON’T: Check Portfolio Daily
Don’t look at your portfolio constantly.
- Increases emotional reaction
- Makes panic worse
- Checking doesn’t change outcome
- More you look, more likely to sell
Better: Check quarterly. That’s it.
❌ DON’T: Listen to Doomsday News
Don’t believe:
- “This is different this time!”
- “This is the big one!”
- “Market will never recover”
- “You should be scared!”
News makes money from fear. Ignore it during crashes.
❌ DON’T: Follow the Crowd
Don’t sell because everyone else is.
- The crowd is usually wrong at extremes
- When everyone is panicking, that’s when you should be brave
- Crowd sells at bottom (worst time)
❌ DON’T: Try to Time the Bottom
Don’t try to sell at top and buy at bottom.
- Impossible to time perfectly
- You’ll guess wrong
- You’ll miss recovery
- Dollar-cost averaging beats timing
❌ DON’T: Stop Investing
Don’t pause your monthly dollar-cost averaging.
- Keep buying monthly
- You’re buying cheaper shares
- This builds wealth
- Biggest mistake is stopping
What TO DO During a Crash
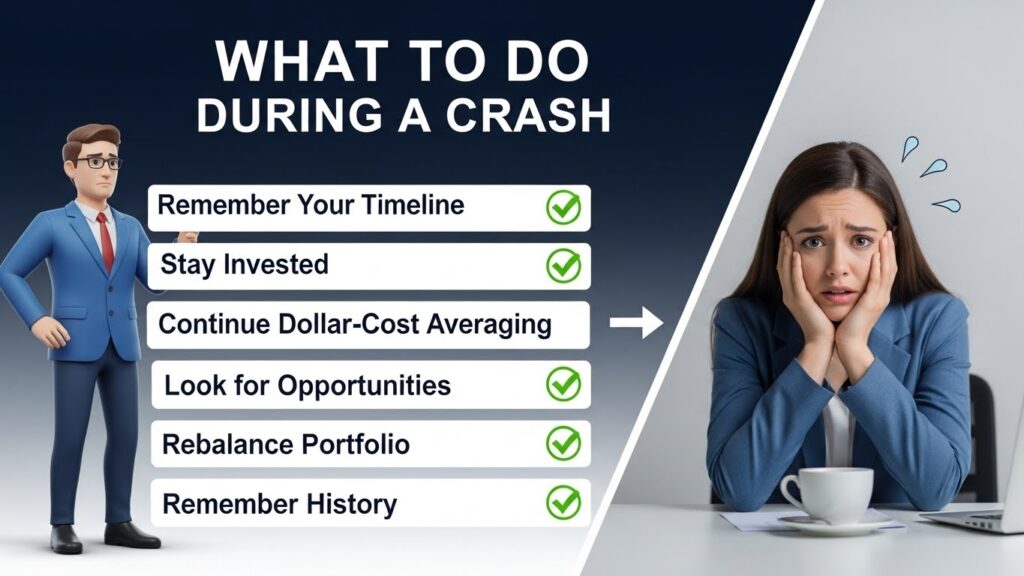
Clear action plan.
✅ DO: Remember Your Timeline
Ask yourself:
- Do I need this money within 5 years? (If yes, shouldn’t have been in stocks)
- Is my timeline 10+ years? (If yes, crash doesn’t matter)
- Can I wait 3-5 years for recovery? (If yes, stay invested)
If you have 10+ year timeline, crashes are irrelevant.
✅ DO: Stay Invested
The simplest action: Do nothing.
You’ve done the hard work:
- Chose good investments
- Built diversified portfolio
- Set up dollar-cost averaging
Now just let it work.
✅ DO: Continue Dollar-Cost Averaging
Keep your monthly investment schedule.
Why this is powerful:
- Market down 30%
- Your $500/month now buys MORE shares
- You’re buying the dip automatically
- When market recovers, you have more shares
Example:
- Normal times: $500 buys 5 shares at $100
- Crash: $500 buys 7.1 shares at $70
- You’re accumulating more at discount
- When recovers to $100, you have more wealth
✅ DO: Look for Opportunities
If you have extra cash:
- Now is time to deploy it
- Prices are on sale
- This is how serious investors get rich
- Crashes create the best opportunities
But only if:
- You have emergency fund intact
- You won’t need money soon
- You can commit to holding
✅ DO: Rebalance Your Portfolio
If you have stocks and bonds:
During crash:
- Stocks crash 30%
- Bonds hold value or rise
- Your portfolio becomes imbalanced
- Now is perfect time to rebalance
How:
- Sell some bonds (up in value)
- Buy stocks (down in value)
- Return to target allocation
- You just bought low and sold high
✅ DO: Remember History
Every crash in history recovered.
- 1929: Recovered (took 25 years, but recovered)
- 1987: Recovered (2 years)
- 2000: Recovered (5 years)
- 2008: Recovered (4-5 years)
- 2020: Recovered (4 months)
Pattern: 100% recovery rate.
Using Crashes to Build Wealth
Mindset shift: Crashes are opportunities.
The Serious Investor’s Response
When crash happens:
- Fear hits everyone
- Panic-sellers sell (weak hands exit)
- Serious investors buy (strong hands enter)
- Money transfers from weak to strong
Result: Serious investors accumulate shares cheap.
The Math
Scenario: 20-year accumulation
Investor A (No crashes):
- Buys at regular prices for 20 years
- Average cost: $100/share
- Total shares: 10,000
Investor B (With crashes):
- Buys at regular prices: 6,000 shares
- Buys during crashes (extra money): 4,000 shares
- Average cost: $85/share (cheaper!)
- Total shares: 10,000
When market recovers to new highs at $150:
- Investor A: 10,000 × $150 = $1,500,000
- Investor B: 10,000 × $150 = $1,500,000 (same)
BUT Investor B made extra buys during crashes:
- Extra 2,000 shares from crash buys
- Extra 2,000 × $150 = $300,000 additional wealth!
Difference: $300,000 by using crashes.
Frequently Asked Questions FAQ 👈
Q: What if market keeps crashing? What if it never recovers?
A: Markets have never failed to recover long-term. Even worst crashes in history recovered. This requires patience but history is 100% on your side.
Q: Should I sell some to protect myself?
A: Only if you might need the money soon. If 10+ year timeline, selling locks in losses. Stay invested.
Q: How do I know if it’s a crash or just a pullback?
A: Doesn’t matter. Your strategy is the same: stay invested, keep buying, remember timeline.
Q: What if I’m near retirement?
A: This is why asset allocation matters. You should have reduced stocks 5-10 years before retirement. If you didn’t, reduce now.
Q: Should I buy crypto during crashes?
A: No. Crypto is separate discussion. Crypto crashes harder and recovers unpredictably. Stick to stocks/bonds for crash strategy.
Q: What’s the best indicator a crash is ending?
A: Usually when most pessimistic. When everyone has given up and panic-sold, that’s when recovery begins. Contrarian indicator.
Q: Can I predict the next crash?
A: No. Nobody can. This is why dollar-cost averaging is better than timing.
🎥 BONUS
Want to see what happened in real market crashes and how investors should have responded?
This video shows historical crashes, recovery patterns, and psychological responses:
FINAL THOUGHTS: Crashes Test Your Wealth-Building Resolve
Here’s the truth nobody tells you: Crashes are the ultimate test of whether you’ll actually get rich.
Rich people didn’t get rich by buying high and selling low. They got rich by doing the opposite: staying calm when everyone panics, keeping money invested when fear is highest, and buying cheap shares when prices are on sale.
This is why so few people get rich. It’s not because they can’t do it. It’s because when the test comes (the market crashes), they panic and fail.
You’re different.
You now understand:
- Crashes are normal (not disasters)
- All crashes have recovered (100% historical rate)
- Panic-selling locks in losses (permanent damage)
- Staying invested captures recovery (the profit)
- Crashes create buying opportunities (wealth building)
When the next crash comes—and it will—you’ll know exactly what to do: Nothing. Stay calm. Keep investing. Remember history.
The investors who get rich during crashes aren’t smarter. They’re just more disciplined.
The SEC provides investor education resources about managing emotions during market downturns and understanding market history.
Be disciplined. When fear hits, remember: This too shall pass. And when it does, you’ll be wealthy.
INTERESTING TOPICS
Ready to understand how to diversify your portfolio to weather market crashes?
Want to master dollar-cost averaging so you buy more shares during crashes?
Need to learn how market volatility connects to crashes and recovery?
Want more financial insights delivered to you? Subscribe to our newsletter
and get weekly articles with practical strategies to grow your wealth sent straight to your inbox.
Obs: Sign up for our newsletter and receive a free Finance For Beginner eBook.
Disclaimer: This article is for educational purposes only. Diversification does not guarantee profits or protect against all losses. Consider your financial situation, risk tolerance, and investment timeline before making investment decisions.
—— End of Article ——